Climate key figures 2024
Our very best for climate protection...
In accordance with the Paris Climate Agreement, we are committed to limiting global warming to 1.5°C.
navigation

Our progress

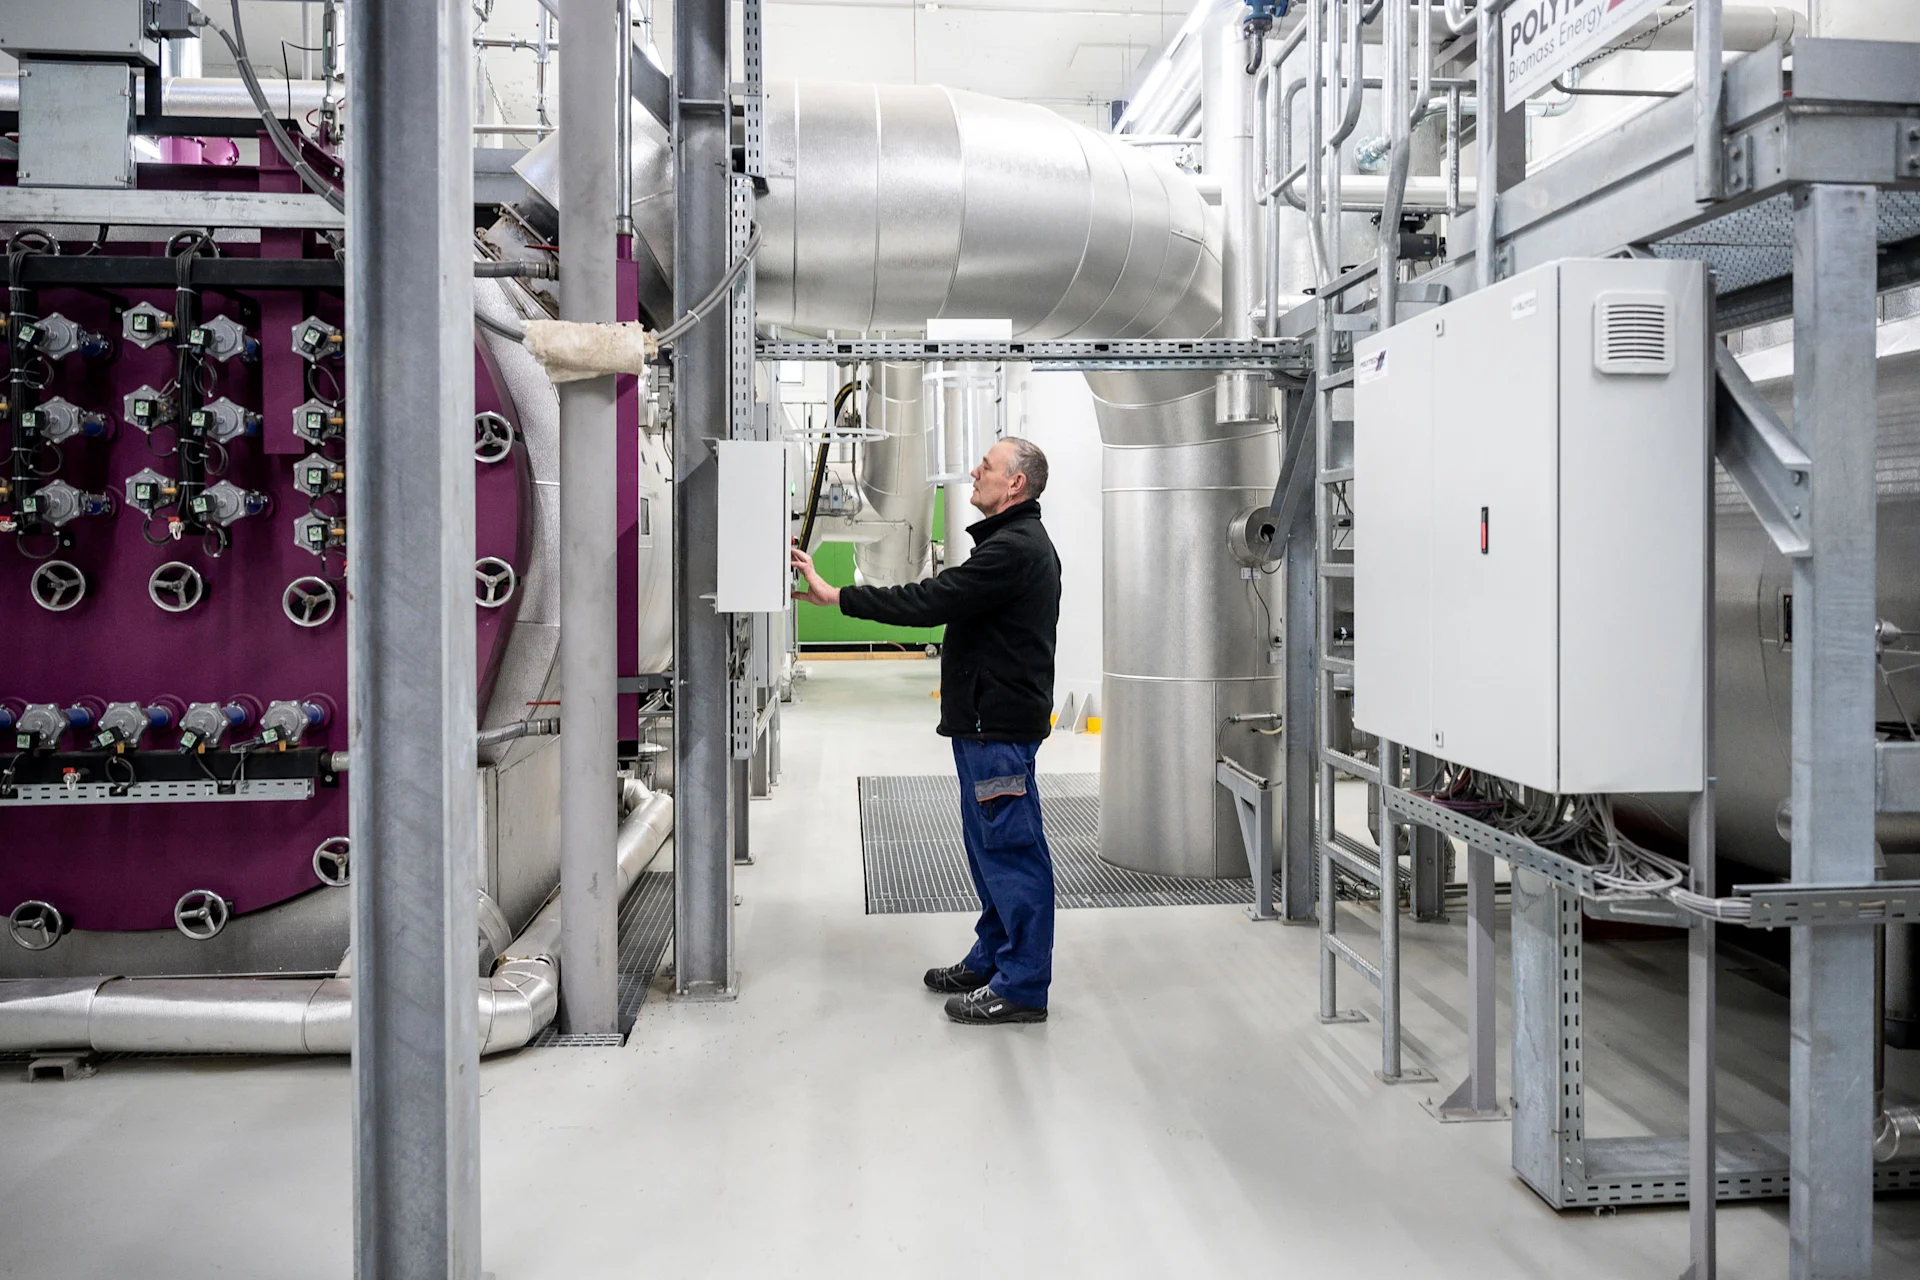
View our key figures to see the progress we are making with regard to climate and energy. Because saving energy, keeping transport routes as short and efficient as possible, and reducing greenhouse gas emissions are our key objectives.
The data for the key figures on climate, energy and transport are collected uniformly across the entire Migros Group using various tools. Invoices (direct invoices or utilities statements) and installed meters are the basis for data collection. In some cases, estimates are also made on the basis of empirical values using clearly defined methods. If necessary, the basic data is converted into the reported energy and emission values using standardised formulas. As data quality constantly improves over the years, this can also affect older data. Every year, we publish the best-quality data.
In 2019, the scope of the Migros Group companies and sites included was adjusted in accordance with the SBTi objectives. The 2020 to 2022 values were calculated in part using extrapolations and planned values. Our figures can be converted into joules using the factor 1 kWh equals 3,600 kJ.
To determine our CO₂ emissions, we convert all relevant greenhouse gas emissions (GHG emissions) into CO₂ equivalents (CO₂ eq) in accordance with the Greenhouse Gas Protocol (GHG Protocol). The conversion of GHG emissions into CO₂ equivalents is based on the Global Warming Potential (GWP) according to the Fifth Assessment Report of the Intergovernmental Panel on Climate Change (IPCC 2013). It is based on over 100 years of data. The emission factors are primarily taken from the DETEC life cycle assessment database DQRv2:2022 (KBOB, ecobau and IPB 2022). For direct combustion emissions, we used the emission factors according to Switzerland’s greenhouse gas inventory (FOEN 2022) where available.
We submitted our target for the Science Based Target initiative (SBTi) in accordance with operational control. The starting point for our system boundaries is the consolidation scope (see our Annual Report).
1 Emissions from the purchase of district heating are included as scope 1.
2 Owned vehicles (trucks, light commercial vehicles and cars).
3 Emissions for electricity (scope 2) are reported on a market basis.
4 From 2021, the entire Migros Group has committed to procuring only renewable electricity.
Biogenic emissions are calculated using the same input data as for scope 1 & 2. This includes wood, biogas, biofuel and biodiesel.
Commentary on the target status at the end of 2024:
The increase in biogenic emissions is mainly due to the rise in heat generation from wood and the increased consumption of Swiss biogas in the truck fleet.
To calculate the intensity quotient of GHG emissions, operational emissions (scope 1 & 2) are compared with sales (in CHF million). The emission values correspond to the chart “Emissions from operations (scope 1 & 2)” and also include category 8 of scope 3, as we apply the same rules for rented and owned space.
1 Stores, leisure facilities, operations centres, distribution centres and the Federation of Migros Cooperatives. Since 2021 incl. tegut...
2 Based on data from Denner (since 2021 incl. Denner Partner franchise concept) and Digitec Galaxus
1 Consideration of KK_R22 and KK_R401A/B, converted into tonnes of CFC-11 eq. The conversion to tonnes of CFC-11 eq is based on the factors of the Federal Office for the Environment (FOEN 2019): “List of the most important substances and preparations that deplete the ozone layer, the import and export of which are subject to authorisation in accordance with Annex 1.4 ORRChem” or Annex 1 of the Montreal Protocol (as of May 2020).
Commentary on the target status at the end of 2024:
The interim targets for 2024 were not met, mainly due to higher than expected refrigerant losses (accidents).
Comment on the target status at the end of 2024:
The interim targets for 2024 were not met, mainly due to higher than expected refrigerant losses (accidents).
We calculate the emissions in our supply chain (scope 3) in accordance with the requirements of the Greenhouse Gas Protocol.
The Migros Group has used 2019 as the reference year for its reduction targets up to 2030 and for the target of net zero by 2050. The values were calculated and checked in collaboration with an external expert office (Intep).
In order to accurately measure our progress, we will adjust our baseline values in the event of a relevant change of +/-5%. The basis for this is the consolidation scope, which is reviewed annually. The first step is to check whether sales and purchases are significant on the basis of turnover (consolidated +/-5 per cent). Major adjustments to the scope of consolidation are expected in 2025.
In addition, the baseline value will also be adjusted if the following adjustments also lead to significant changes in the baseline value (threshold: from +/-5%):
errors are found in the data basis
there are adjustments to the methodologies of the GHG Protocol
there are adjustments to the calculation methods
better basic data is available and data gaps have been closed
we get better access to primary data
1 To measure the annual interim targets, transportation under own responsibility and all air transportation are reported separately. Under "own responsibility" means that a Migros Group company acts as a freight payer. Emissions from transportation under third-party responsibility are estimated based on the product range and indirectly addressed through supplier engagement.
2 Considered in Scope 1 & 2, which is why no value is shown here.
3 It is not possible to calculate the financed issues from the lending business and the assets managed by Migros Bank for 2024. The necessary data will be compiled in 2025 and will be included in the disclosure as far as possible. Further information can be found in the Migros Bank Sustainability Report.
The following table provides a detailed overview of Migros Supermarket Ltd’s and Denner’s FLAG emissions, broken down by the most important food categories. It complements the comprehensive presentation of Scope 3 emissions for the entire Migros Group.
Comment on the target status at the end of 2024:
Reduction measures in the supply chain and agriculture can only be mapped to a certain extent at this stage. The reduction is attributable to changes in the product range. Migros will maintain its efforts to significantly reduce GHG emissions in agriculture over the coming years.
Comment on the target status at the end of 2024:
The increase in SBTi suppliers worldwide is not progressing as quickly as expected. The Migros Group will use specific measures to address the 2025 target to ensure it is met over the coming years.
* Group 1:
Plant-based protein products = pulses, nuts and seeds, algae and other vegan/vegetarian alternative products for meat, fish & eggs based on soya, wheat (seitan), pea protein, etc.
Animal protein products = meat/fish/eggs, mono-products and processed
** Group 2:
Plant-based protein products = vegan/vegetarian alternatives to dairy products
Animal protein products = milk, cheese, yoghurt, cream
*** Baseline according to WWF methodology
Comment on the target status at the end of 2024:
The reduction of upstream transport emissions requires long-term involvement from suppliers and service providers.
Comment on the target status at the end of 2024:
Since 2023, only non-FLAG emissions have counted towards this target. This explains why we are currently not on track with this target. We nevertheless succeeded in increasing the share by 14% compared to 2023.
Comment on the target status at the end of 2024:
The reduction of upstream transport emissions requires long-term involvement from suppliers and service providers.
How much energy do we consume every year? To determine this, we calculate our annual energy consumption by operating field and energy source. To calculate the energy intensity ratio, we compare our energy consumption with our sales.
There is no exact data on the itemisation into non-renewable and renewable energy sources before 2021.
The values for electricity and heat also include cooling energy and steam. Our annual electricity production is around 10 GWh.
Comment on the target status at the end of 2024:
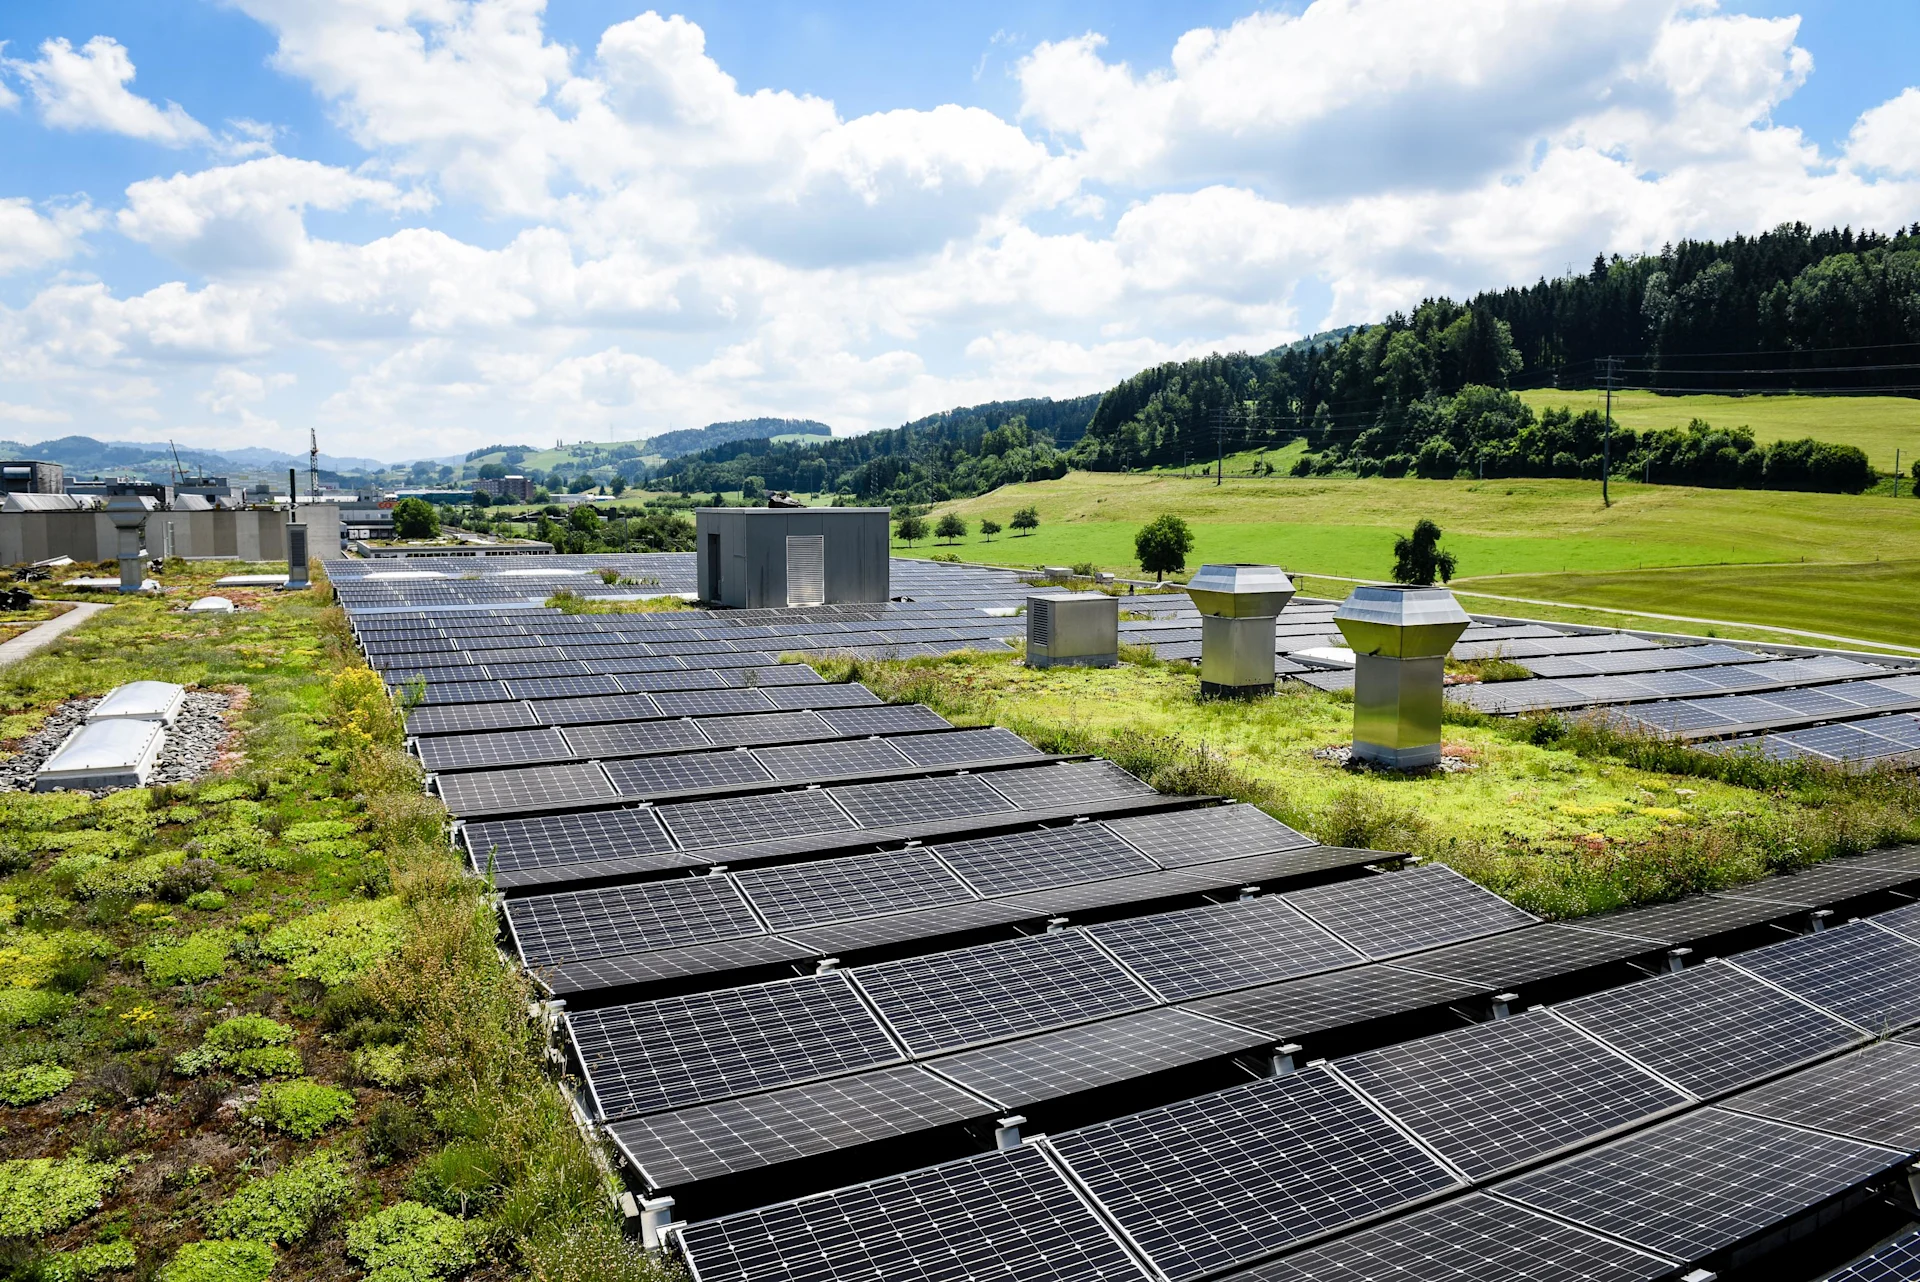
The goal was achieved particularly thanks to the consistent implementation of efficiency principles and the accelerated expansion of photovoltaic systems.
To calculate the energy intensity ratio, energy consumption (according to the “Energy consumption by operating field” table) is compared with sales (in CHF million). The quotient only takes into account energy consumption within the organisation. The comparability of the data for the Migros Group with other retail companies is not specified due to the differing operating fields.
*The output in kWp for 2019 and 2020 is not available. The figures indicated refer to production in MWh.
Rail transport has a much better CO₂ footprint than transport by road. That is why we use rail transport whenever possible. In order to make road transport as environmentally friendly as possible, our ten regional cooperatives have their own fleets of low-emission vehicles – most of the 500 trucks comply with the latest EURO-6 emissions standard, as we want to continuously reduce our CO₂ emissions.
*In the 2023 reporting year, fewer goods were transported by rail than in 2022. This is due to the temporary closure of the route on the north-south axis (Gotthard Base Tunnel) and the shift of combined freight traffic to the road.
Nitrogen oxide and particulate matter emissions are calculated on the basis of mileage in accordance with the performance-related heavy vehicle tax (HVC) and the limit values per EURO standard. For other pollutants (SOx, persistent organic pollutants, volatile organic compounds and other hazardous air pollutants), the limit values are not applicable to all EURO standards. These are therefore not shown. Only the Migros cooperatives and the national distribution centres have their own truck fleets.
There are exciting stories behind the figures. Find out more about our commitment to climate and energy in our stories.

Sustainability
Generated through the fermentation of liquid manure and other residual waste, can then be used for electricity.

Sustainability
With support from the Migros Pioneer Fund, two companies are showing that eco-friendly construction is feasible.

Sustainability
Christine Schäfer, food trend researcher at the GDI, explains why and reveals what might help.

Sustainability
What can you do to ensure that the batterie continues to work perfectly for many years to come?

Farming
Is climate change forcing us to use genetically modified plants for commercial cultivation? A debate.

Climate
We explain what Migros is doing to make refrigeration technology environmentally friendly.

Sustainability
Migros has many chocolates with different labels. But what do “Fairtrade”, “Bio” and “Rainforest Alliance” mean?

Sustainability
No meat for a week, but instead plenty of seasonal vegetables and pulses. A self-experiment.

Climate
Migros is promoting a rapid move to heating greenhouses without the use of fossil fuels.

Climate
To promote e-mobility, we’re installing 2000 new Migros charging points in the years ahead.

Sustainability
Meilen heats houses, apartment blocks and offices using waste heat from the local Migros factory.

Climate
Airing your home properly prevents mould and cuts energy wastage. Six tips for airing your home properly.